

YouTube videos that dominated the charts in Japan over the last 7 days.
The weekly ranking measures consistency over time - every hour spent in the top charts counts. A single-day viral spike carries far less weight than a video that dominates for several consecutive days.
#1Music5 videos
#2Entertainment3 videos
#3Gaming1 videos

5:27
#1
4h in top
THE FIRST TAKE · 4.7M views
5:27
#1
4h in top
4.7M views

3:45
#2
4h in top
ジュニアCHANNEL · 1.1M views
3:45
#2
4h in top
1.1M views
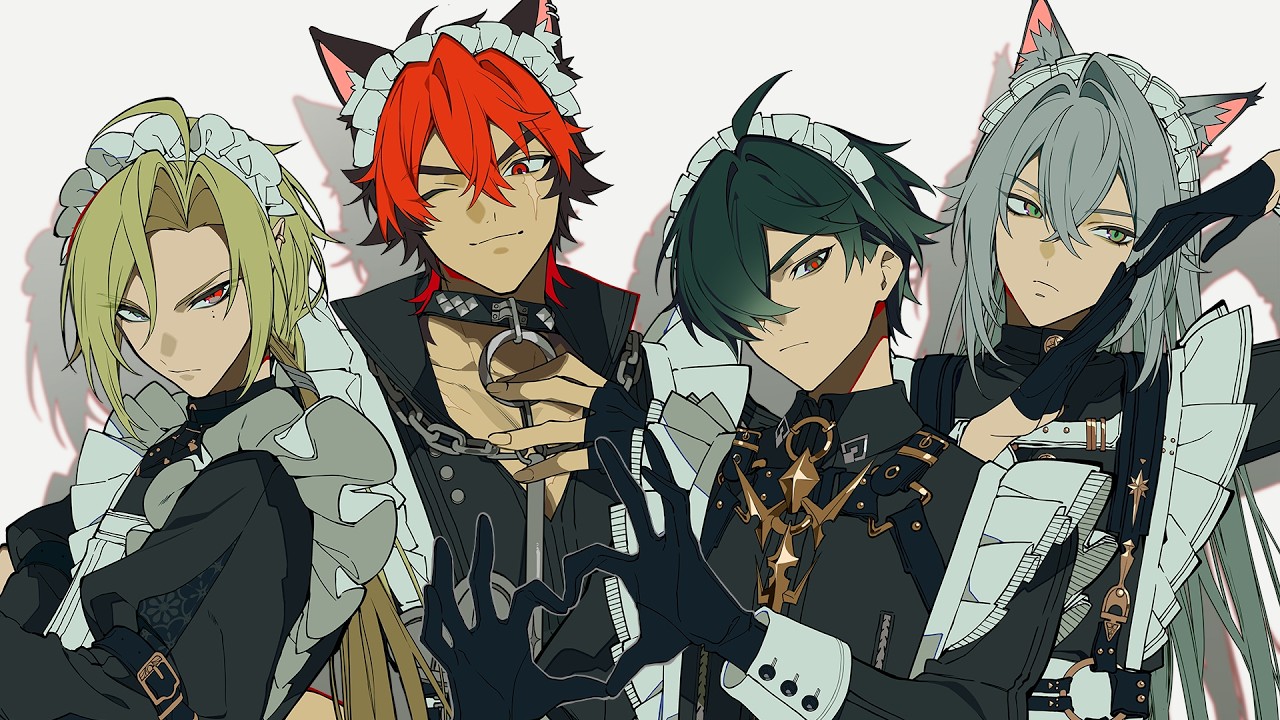
2:37
#3
3h in top
HoYoFair · 732K views
2:37
#3
3h in top
732K views

3:02
#4
3h in top
M!LK · 916K views
3:02
#4
3h in top
916K views

4:30
#5
3h in top
KO1KEYZ · 494K views
4:30
#5
3h in top
494K views

2:58
#6
3h in top
HYBE LABELS · 4.6M views
2:58
#6
3h in top
4.6M views

3:10
#7
3h in top
SMTOWN · 2.7M views
3:10
#7
3h in top
2.7M views

3:53
#8
3h in top
KAWAII LAB. · 339K views
3:53
#8
3h in top
339K views

2:26
#9
2h in top
ソニー・ピクチャーズ 映画 · 2.1M views
2:26
#9
2h in top
2.1M views

6:18
#10
2h in top
THE FIRST TAKE · 1.4M views
6:18
#10
2h in top
1.4M views
Top Channels of the Week